Overview
Who are the users?
Government officials responsible for public infrastructure management
Problem overview
The current practice of measuring and optimizing public infrastructure accessibility is time consuming (waiting for reports from data scientists) and not efficient (lack of one platform where all the relevant information can be viewed)
Goals and objectives
Develop a tool that could measure healthcare accessibility and later incorporate additional industries, like education and energy
Suggest optimal locations for new facilities.
Create a user-friendly tool for government officials with varying levels of tech savviness
Research
Research methods
We conducted user interviews and contextual inquiries with urban planners, government officials, and industry experts to understand their needs and pain points.
Synthesis of research
Key learning were grouped into 3 themes:
Measuring accessibility
Improving accessibility
Data accuracy
Measuring accessibility
Defined problems
Travel mode difference
Healthcare accessibility measurement varies between urban and rural areas due to urban reliance mostly on driving/public transport and rural use of mostly walking/bicycles.
Time and distance thresholds
Different countries use different time or distance thresholds for measuring healthcare accessibility
Different infrastructure systems
The vision of the tool was to later incorporate other infrastructure systems as well, e.g. education, energy, etc.
Solutions
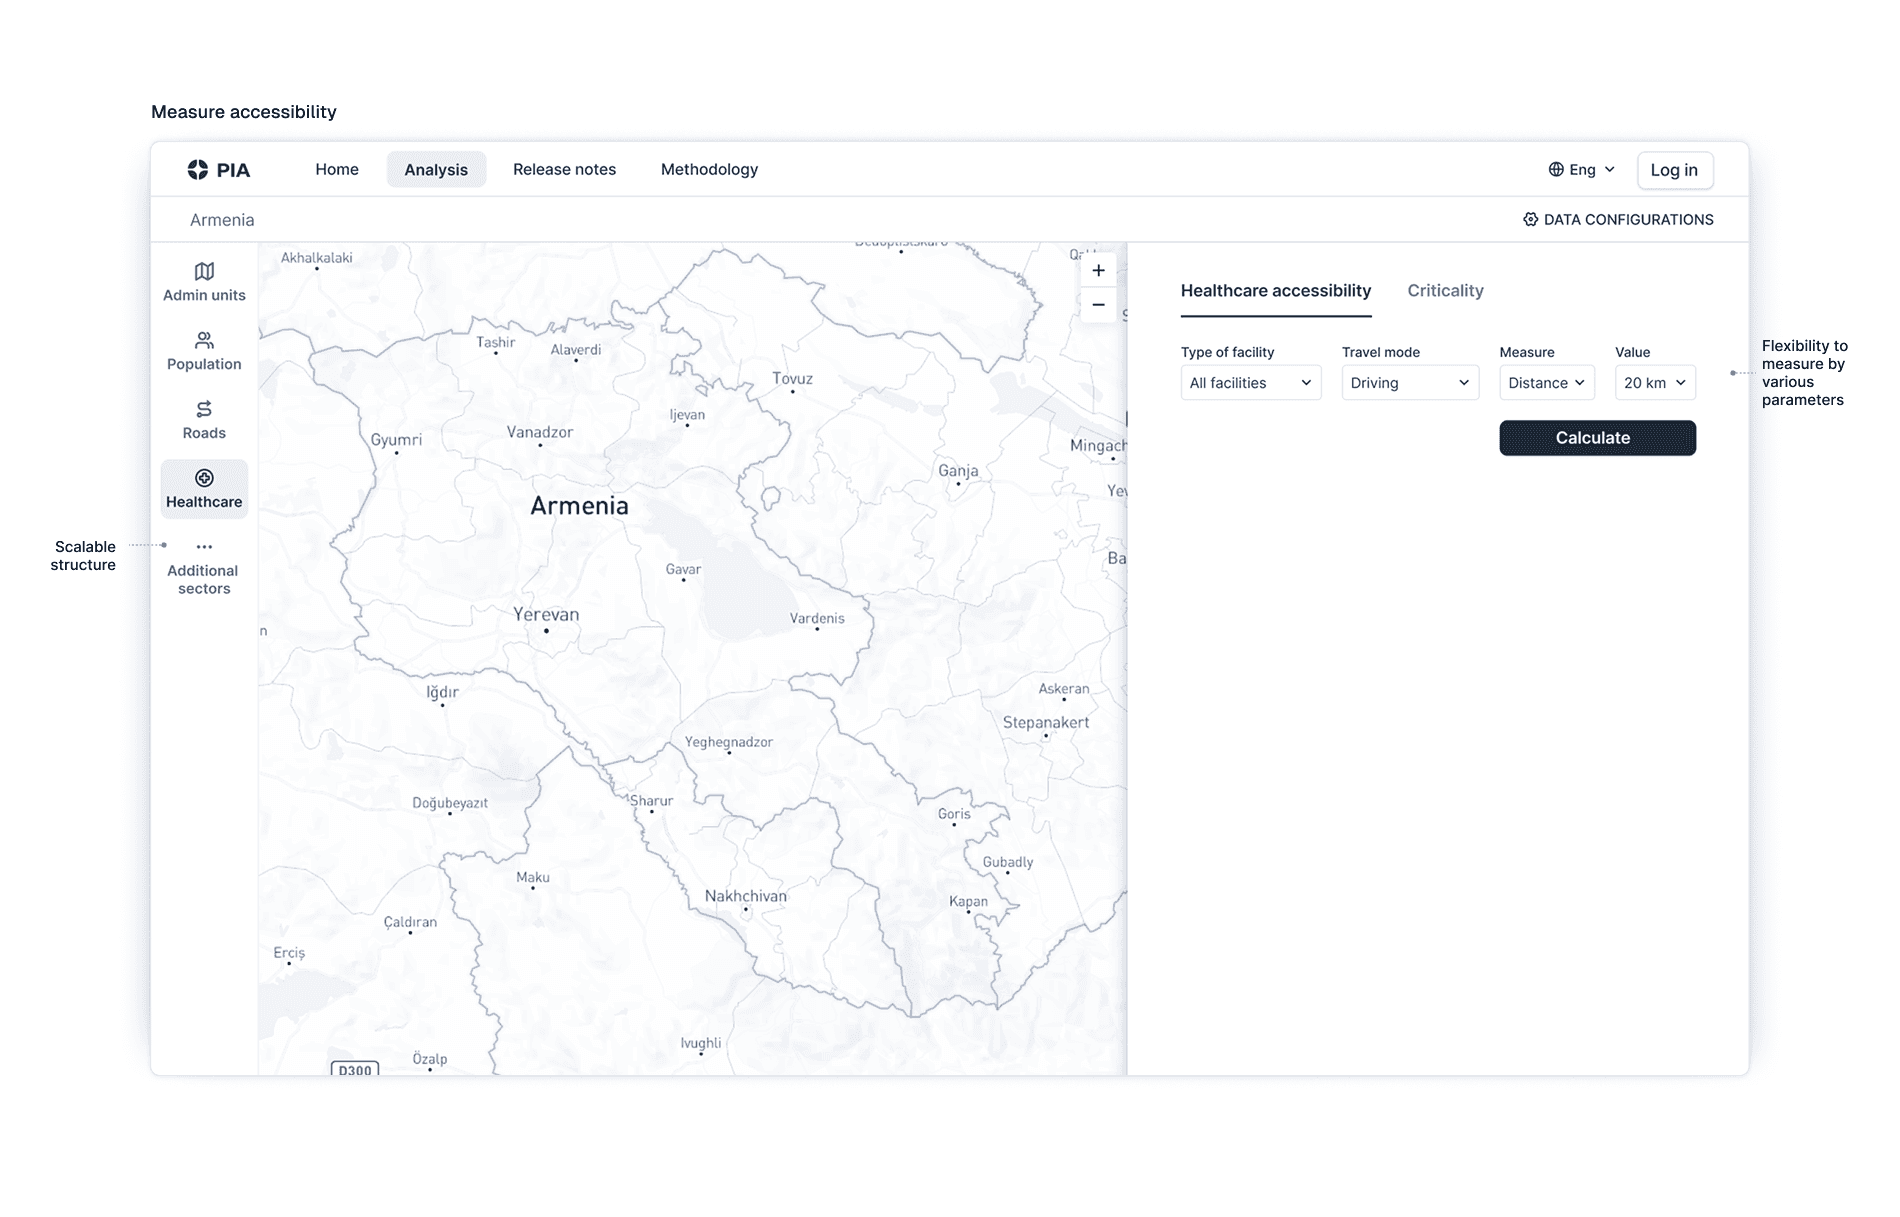
Flexibility
Provide a flexible design to enable measuring accessibility by different parameters
Scalable structure
Provide a scalable structure to enable incorporation of additional sectors later.
Optimize accessibility
Defined Problems
Location for a new facility
Government officials were struggling with choosing the best location for a new facility.
Future demand prediction
The current approach considers only the currently living population, overlooking future demands
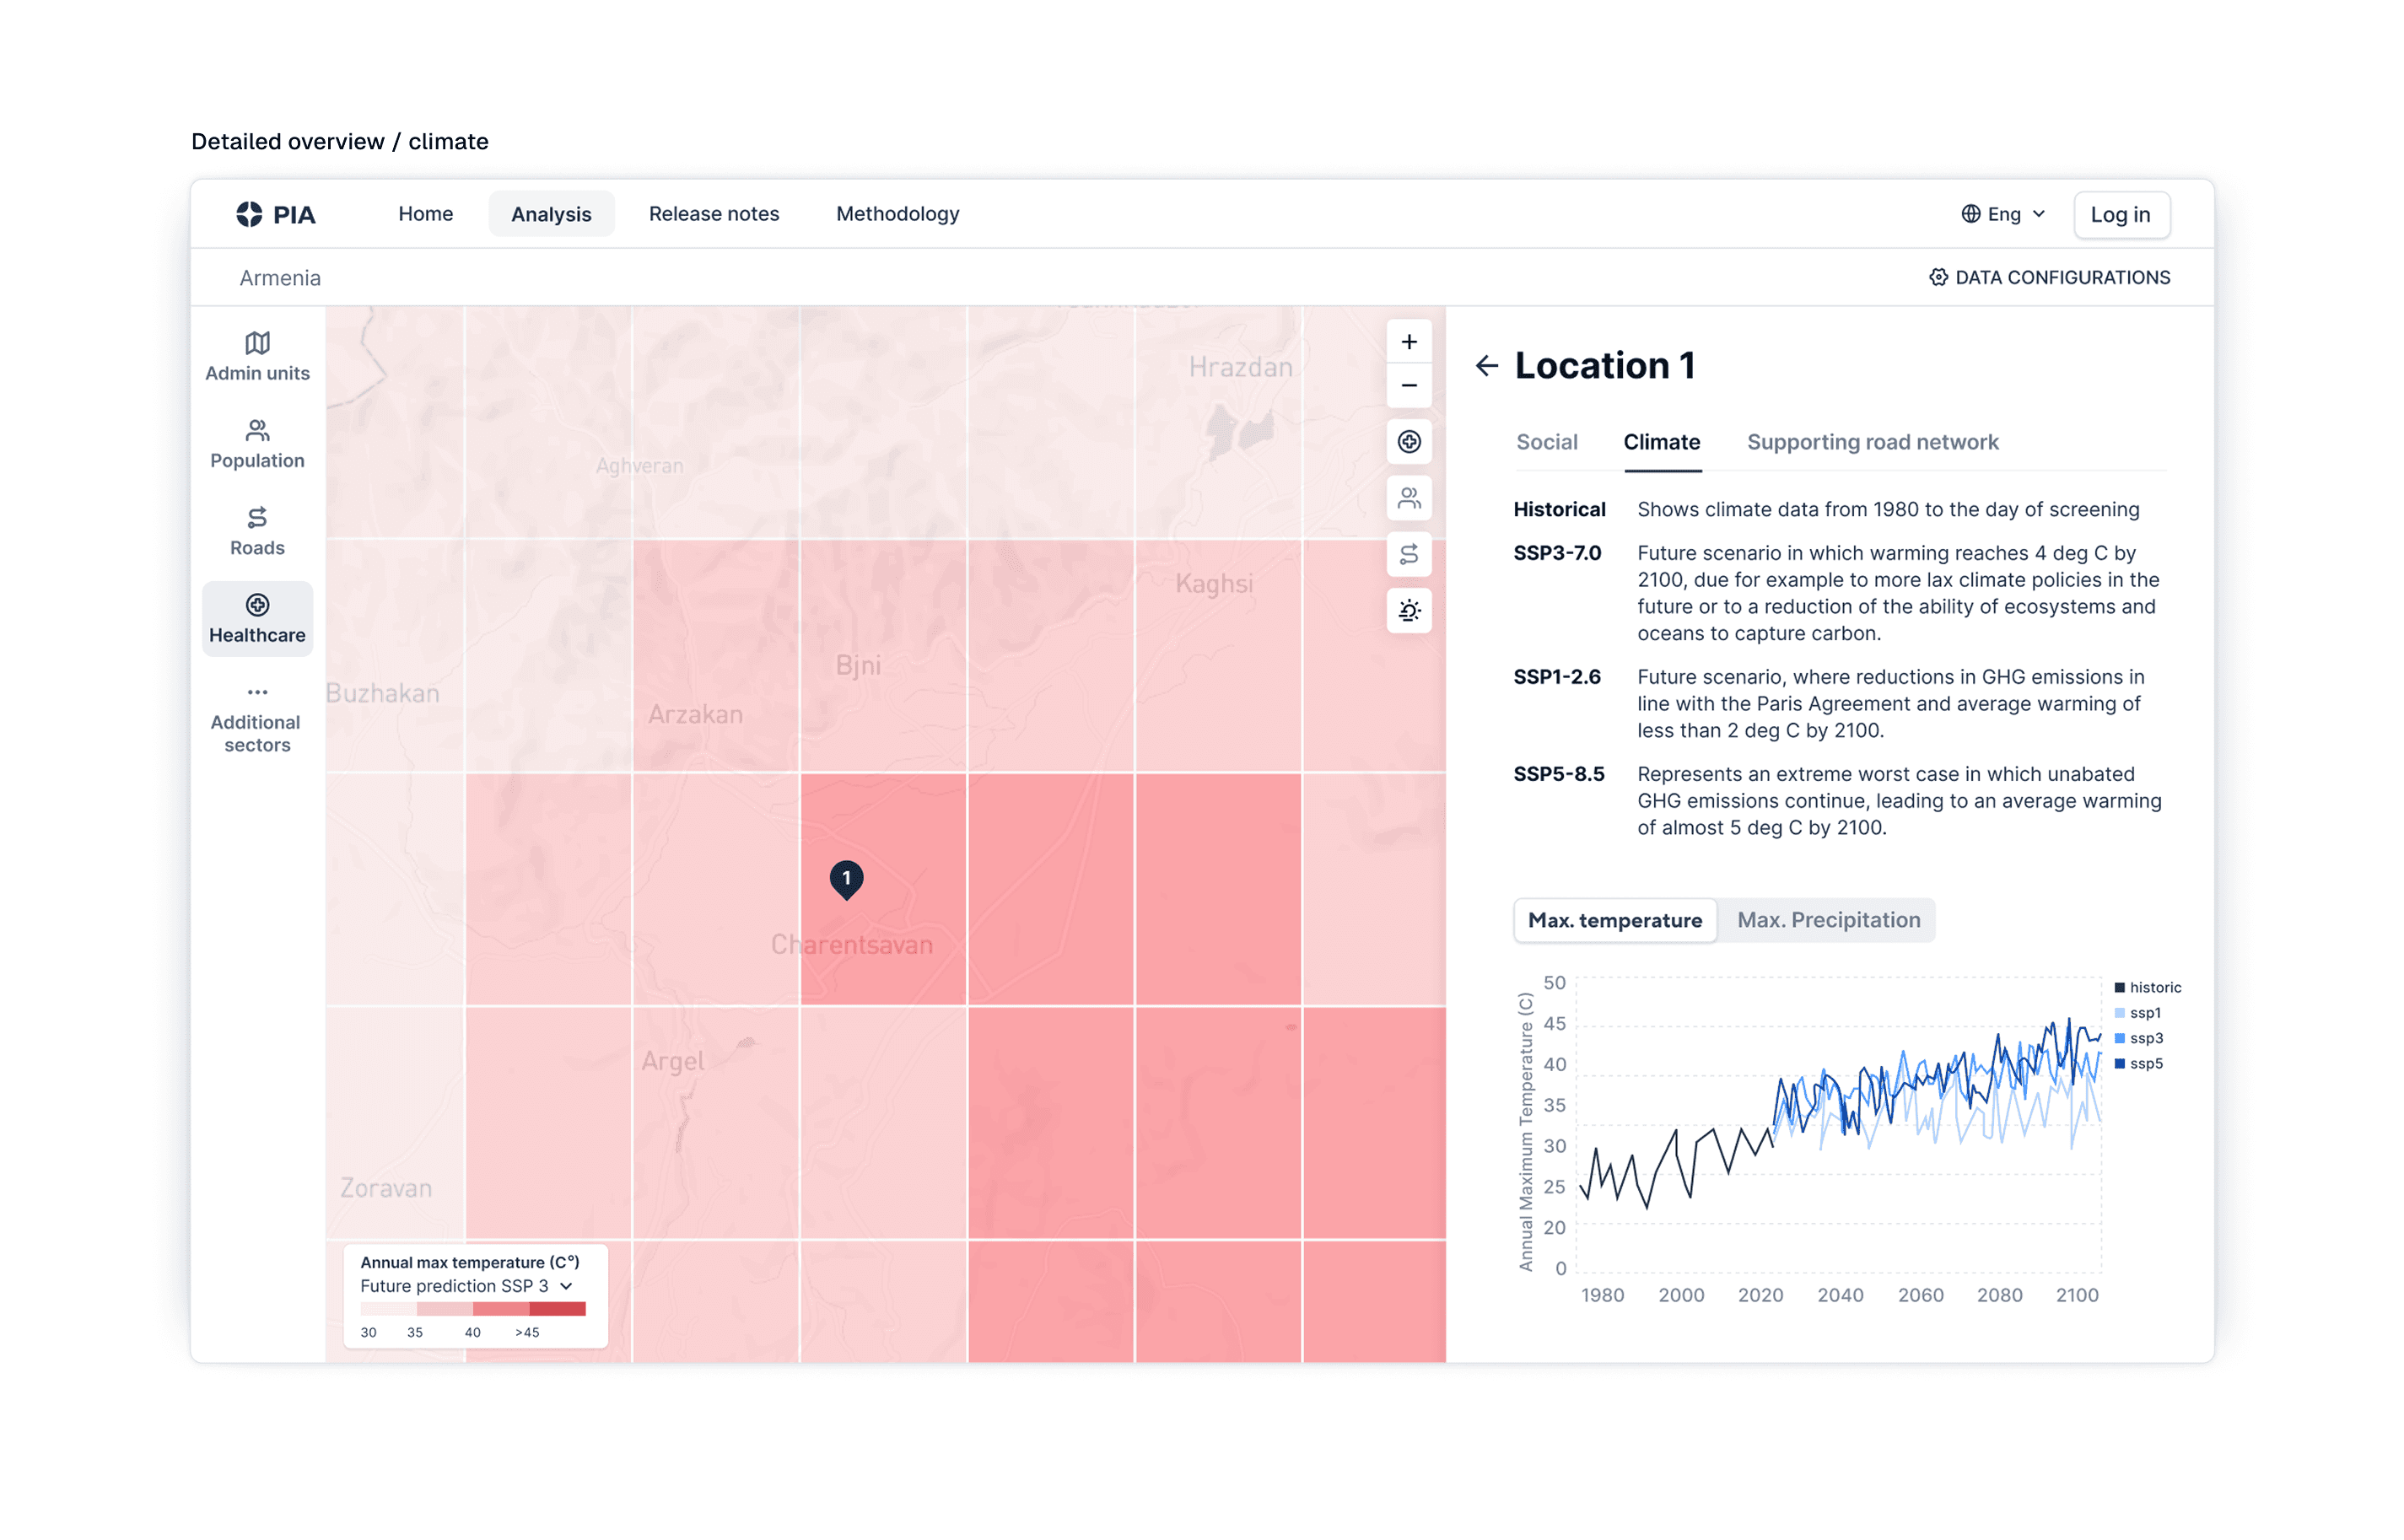
Climate risk
The current approach doesn’t take into account climate change risk.
Solutions
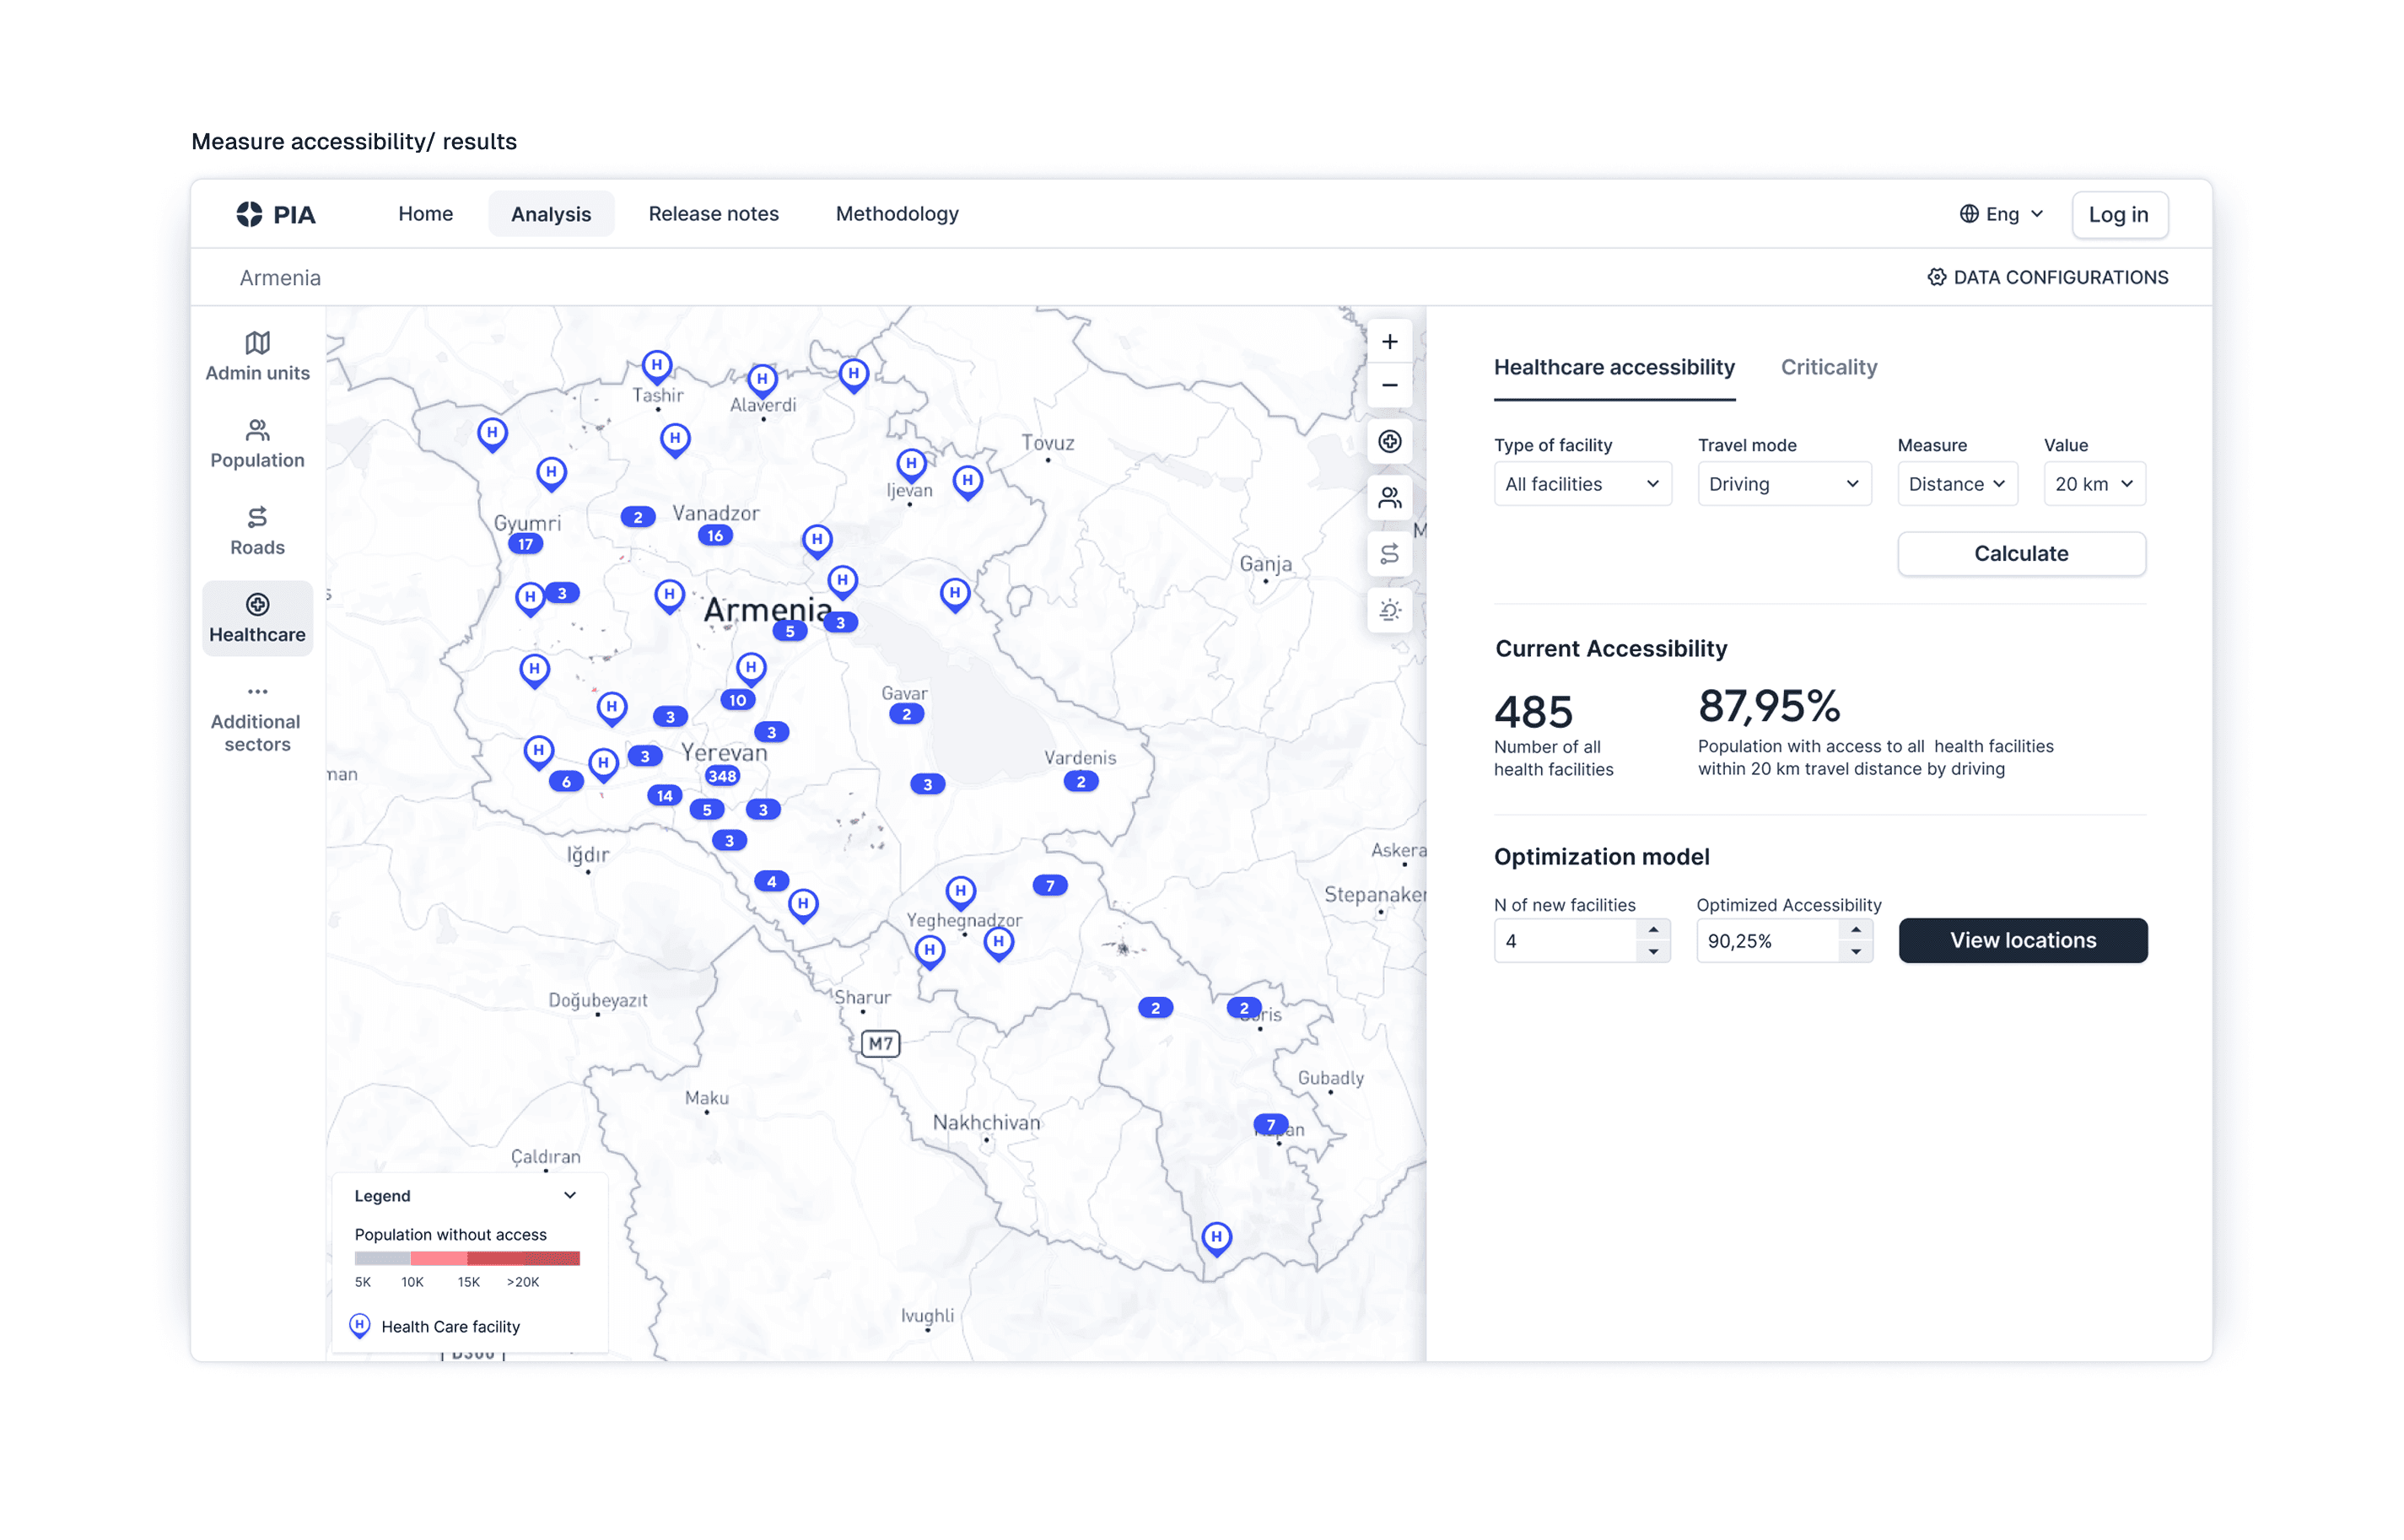
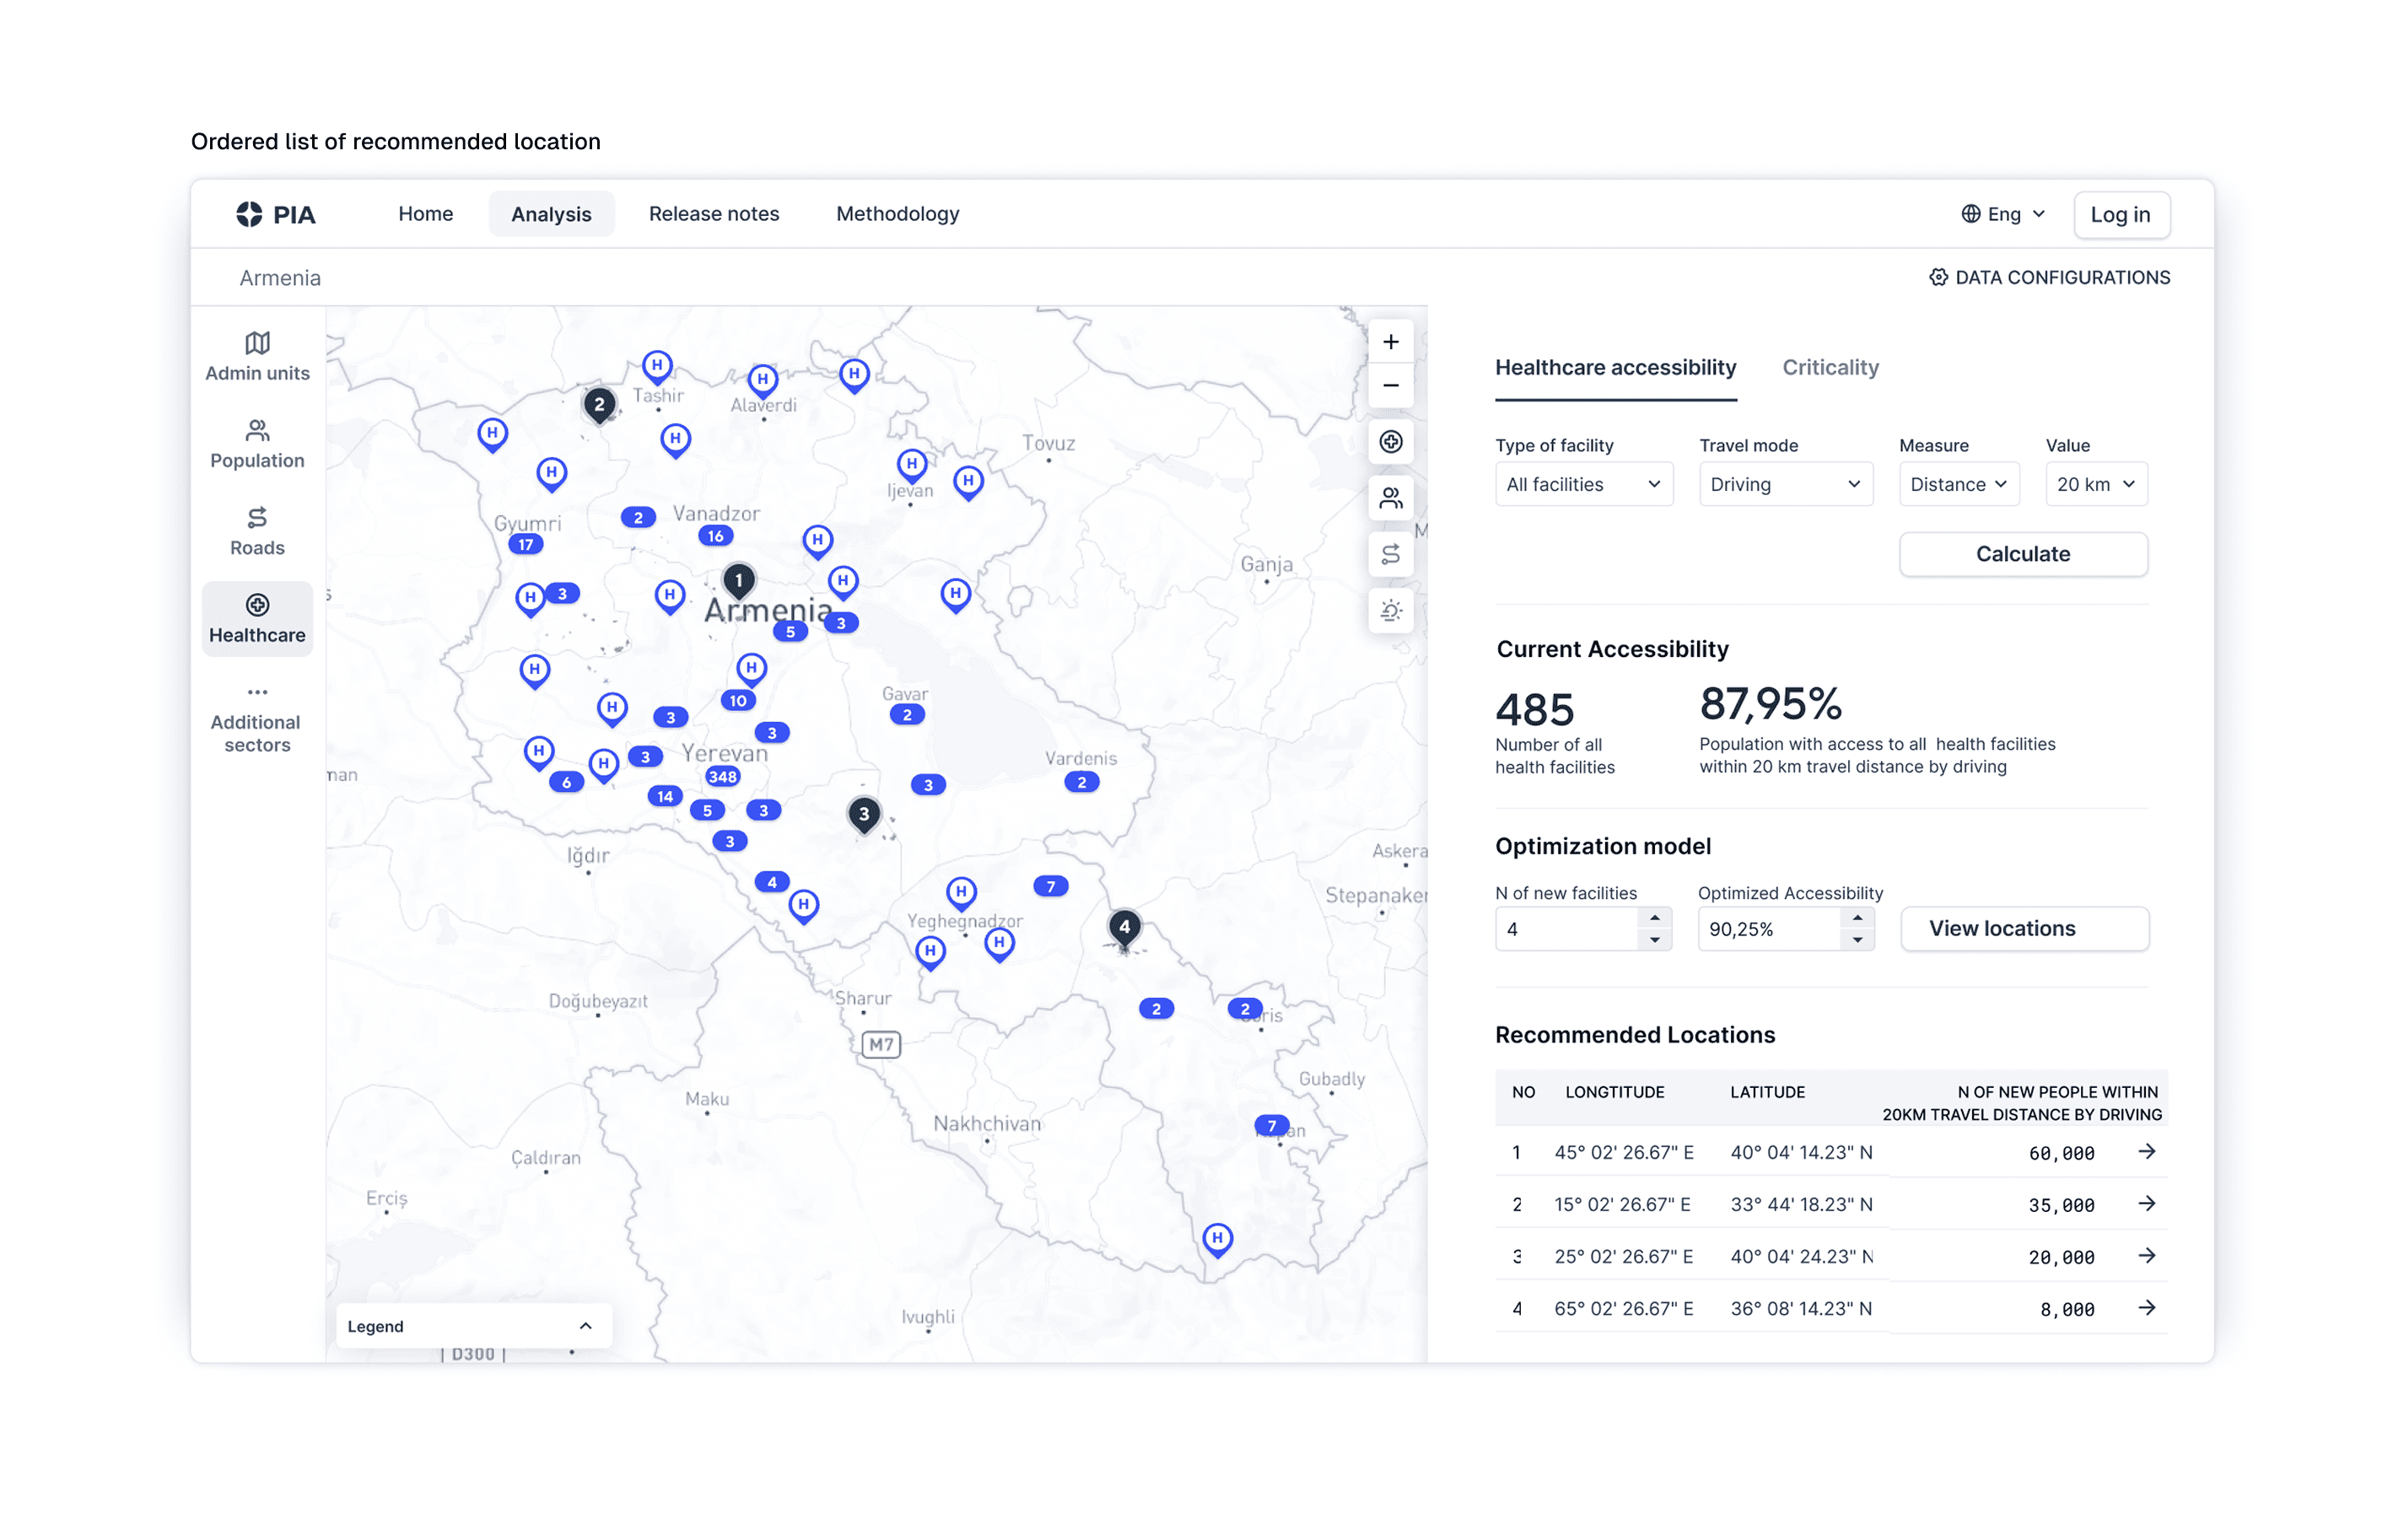
Ordered recommendation
Enumerate the potential locations in order, starting with the one that will enhance accessibility the most.
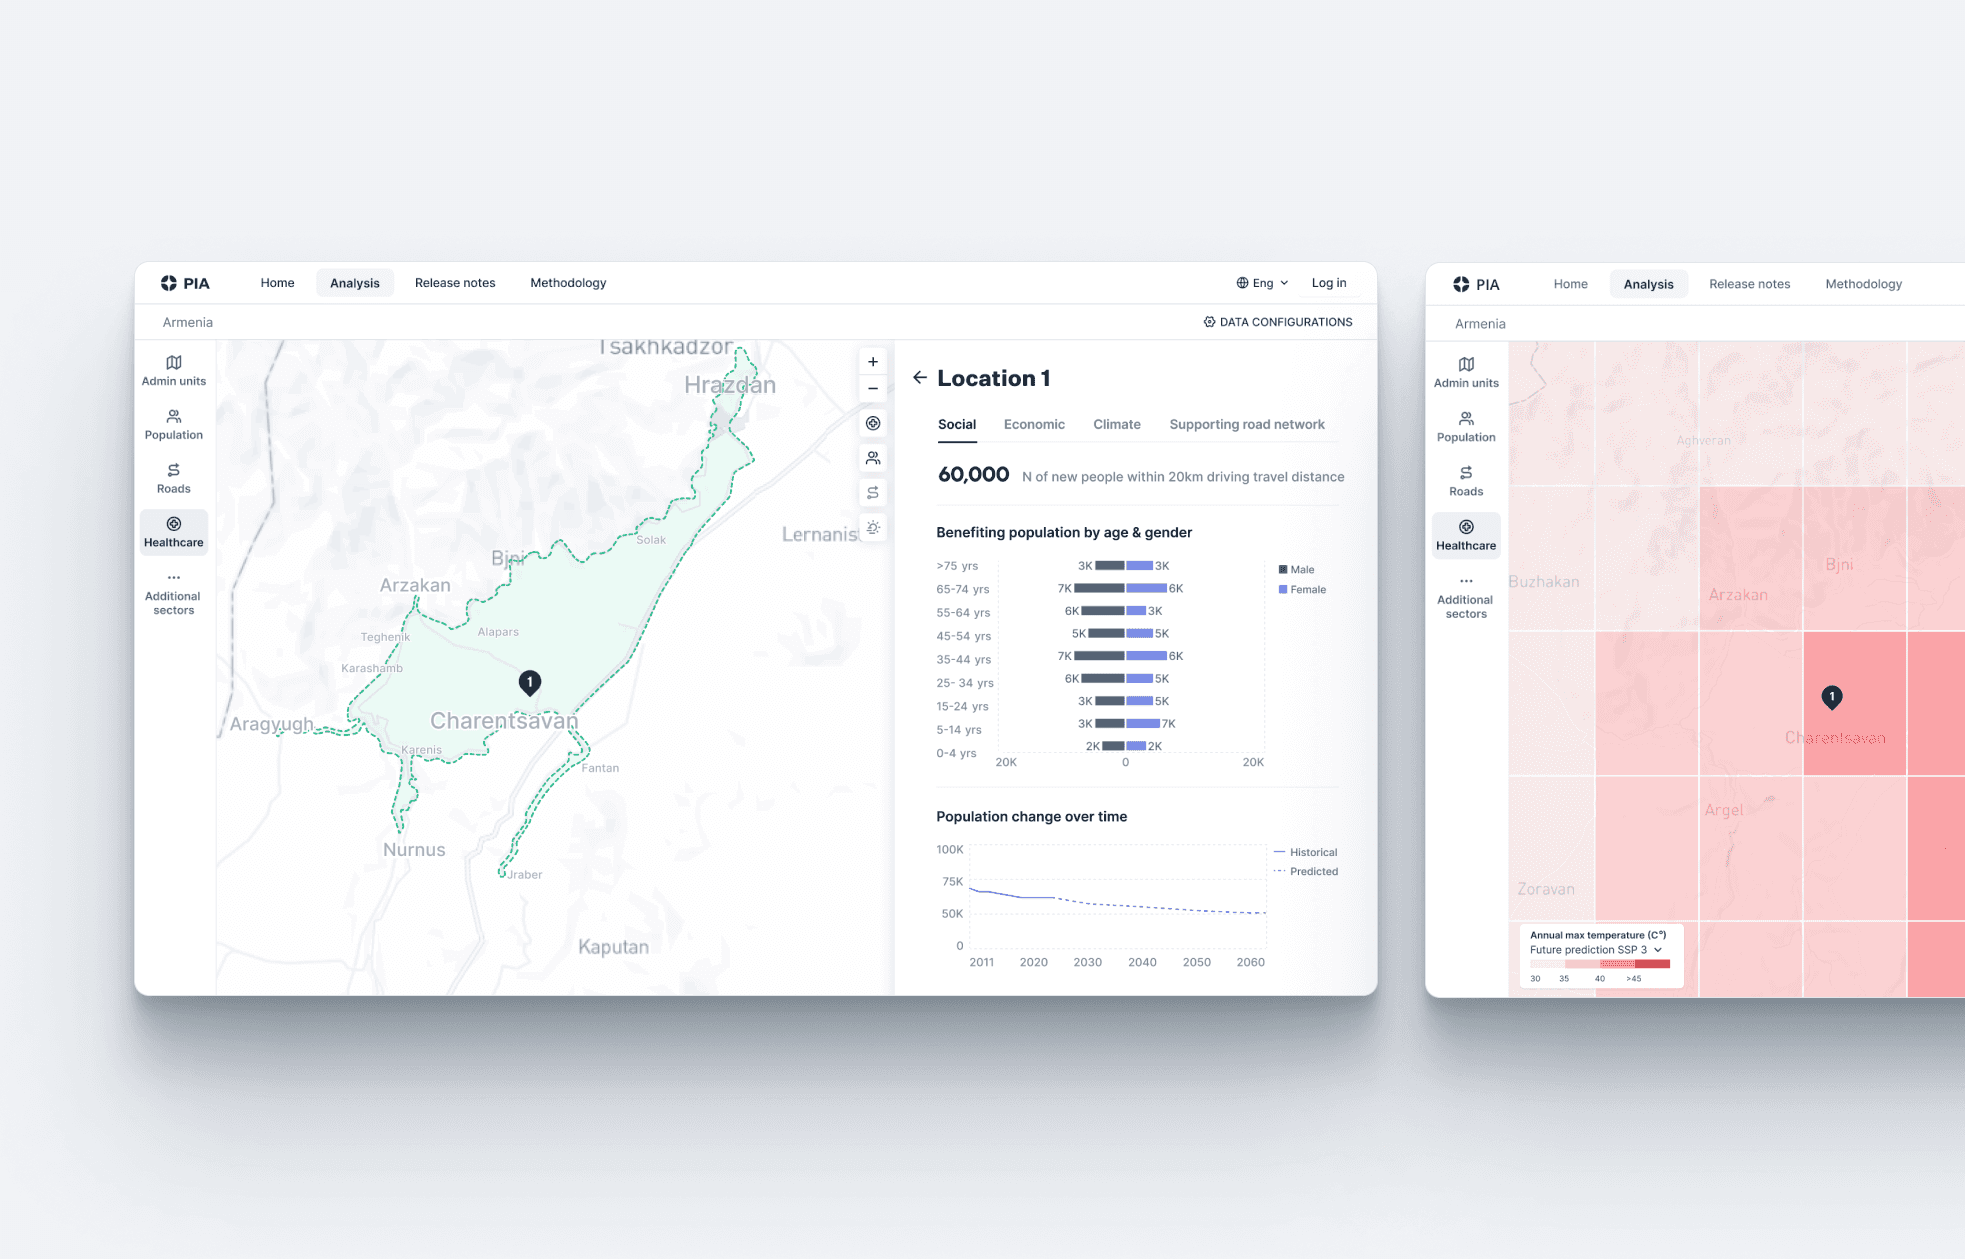
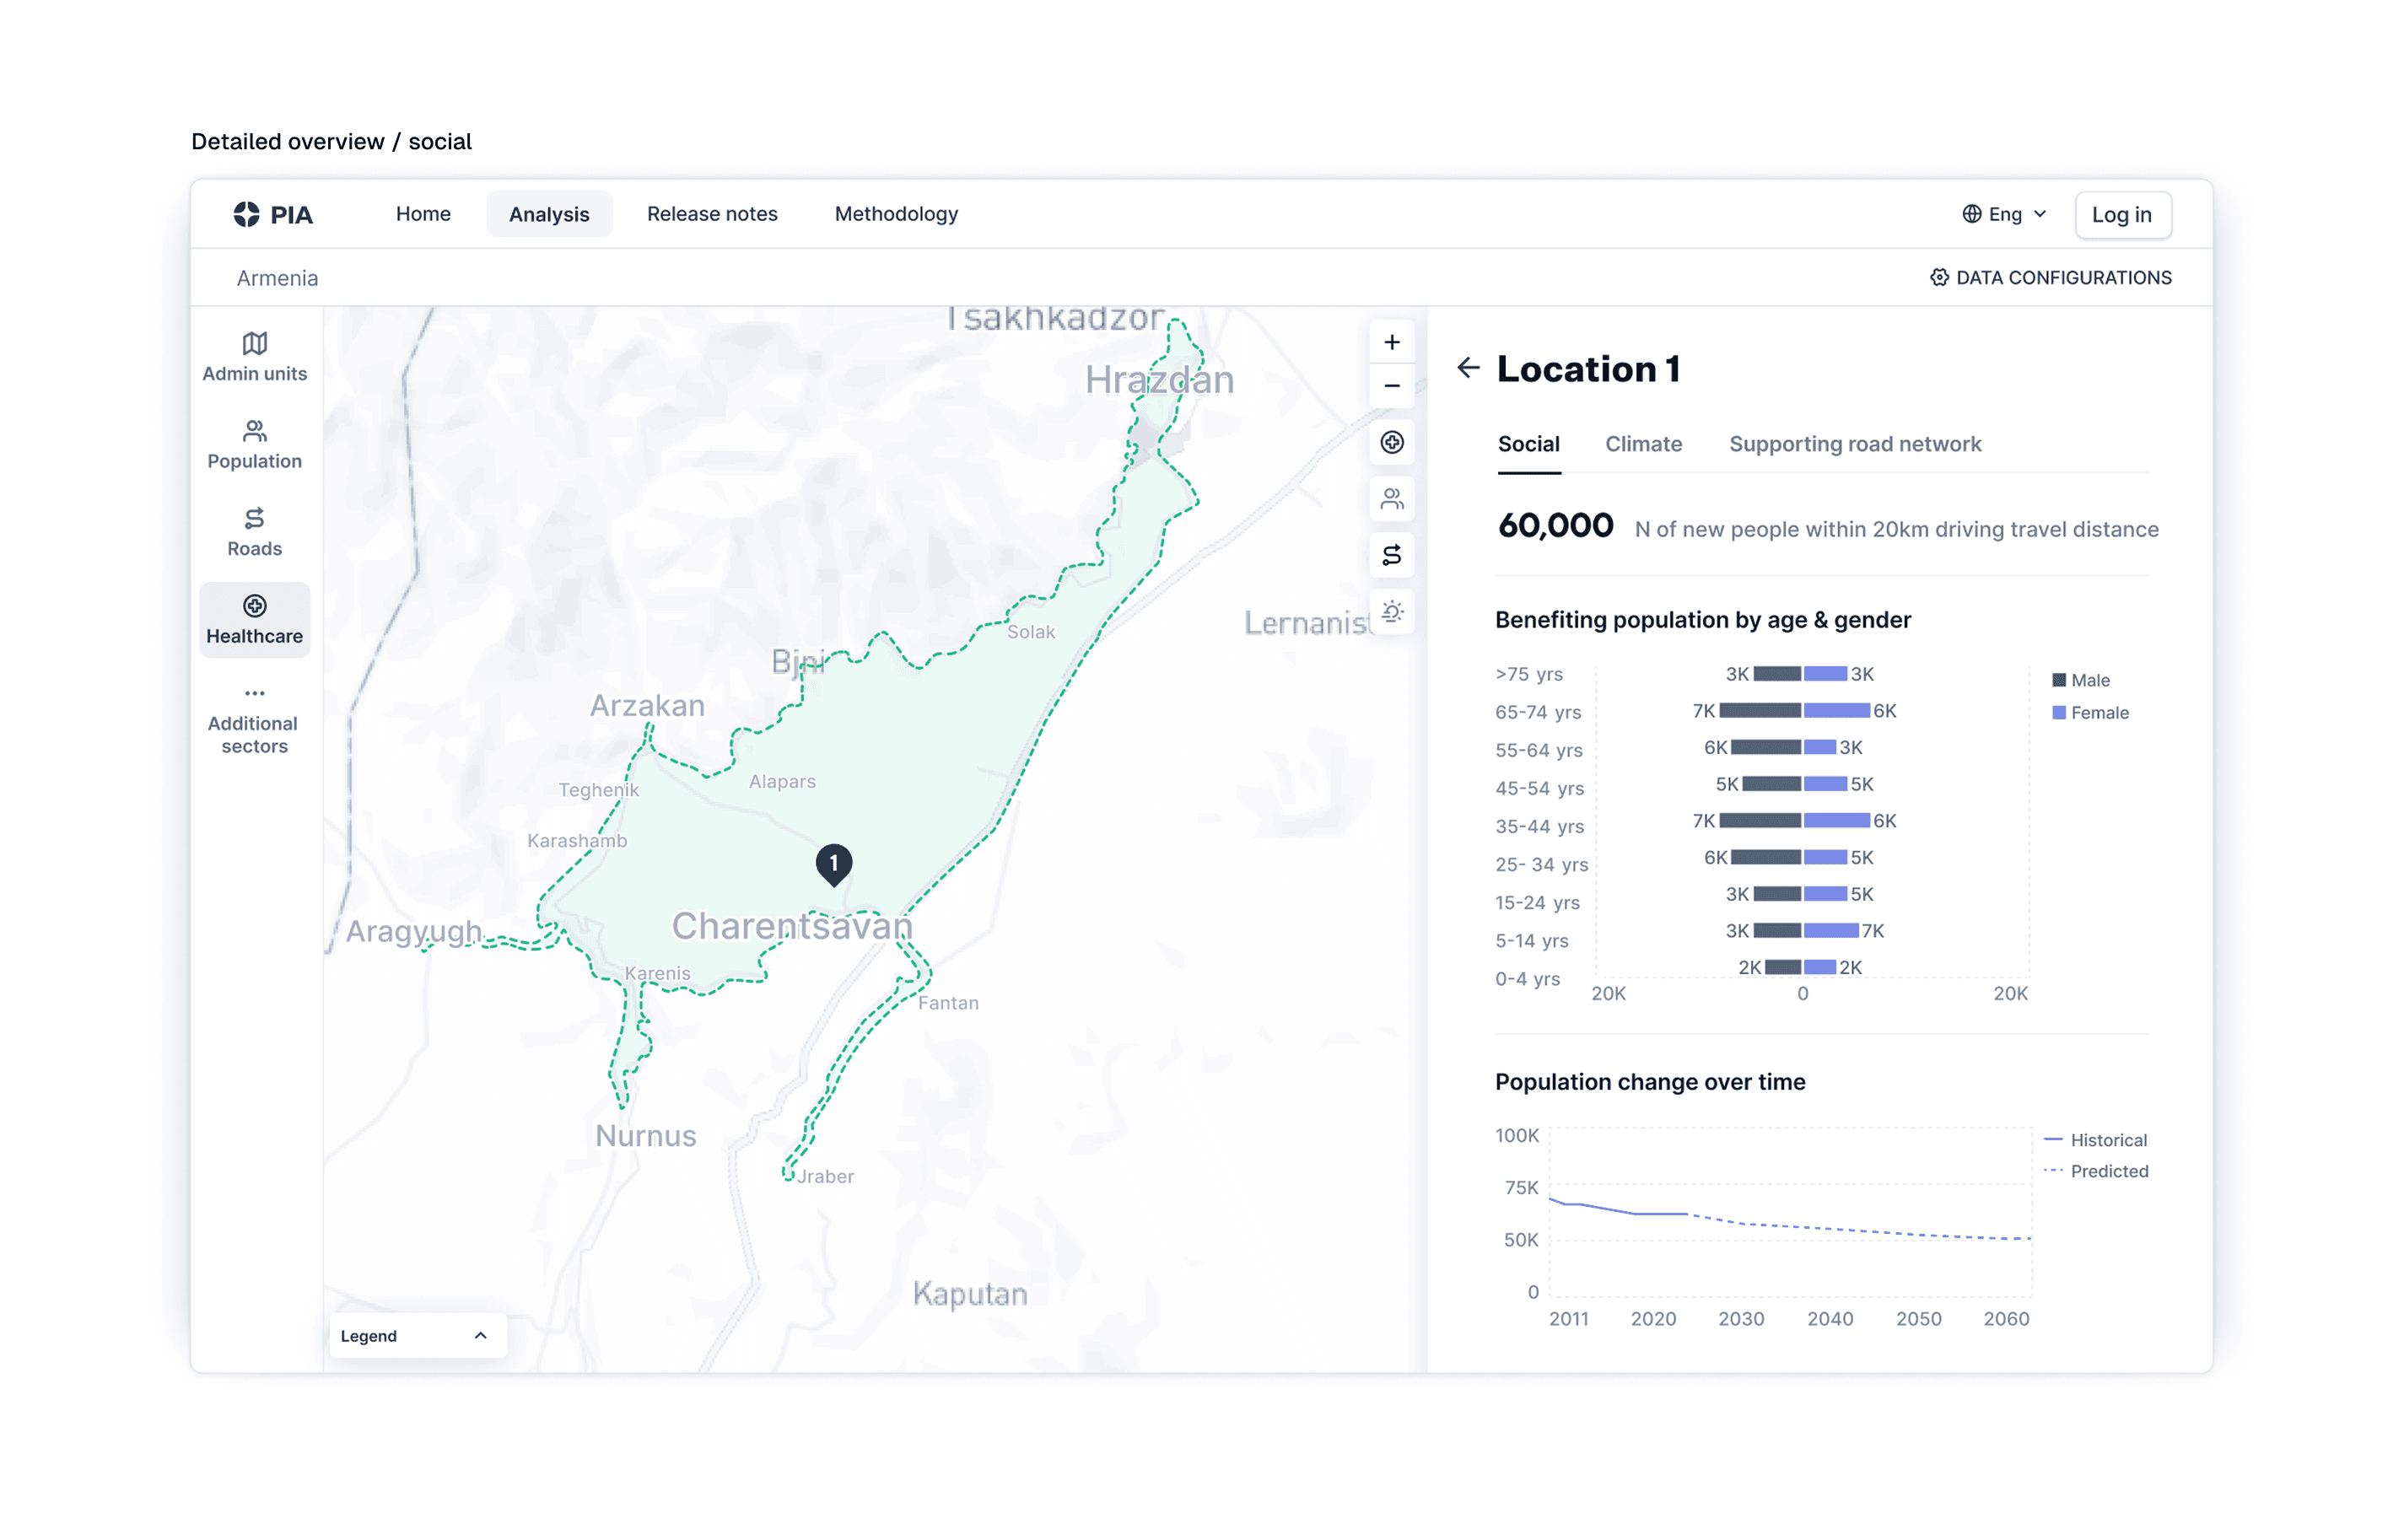
Comprehensive overview
Provide a detailed overview of potential locations, highlighting social, economic, and climate factors, along with the supporting road network.
Population change
Provide population change predictions for each potential location.
Data
Problems
Intergovernmental communication
Government agencies often faced problems getting data from other governmental agencies.
Local over global
At the same time they preferred using local more accurate datasets over globally available ones.
Solutions
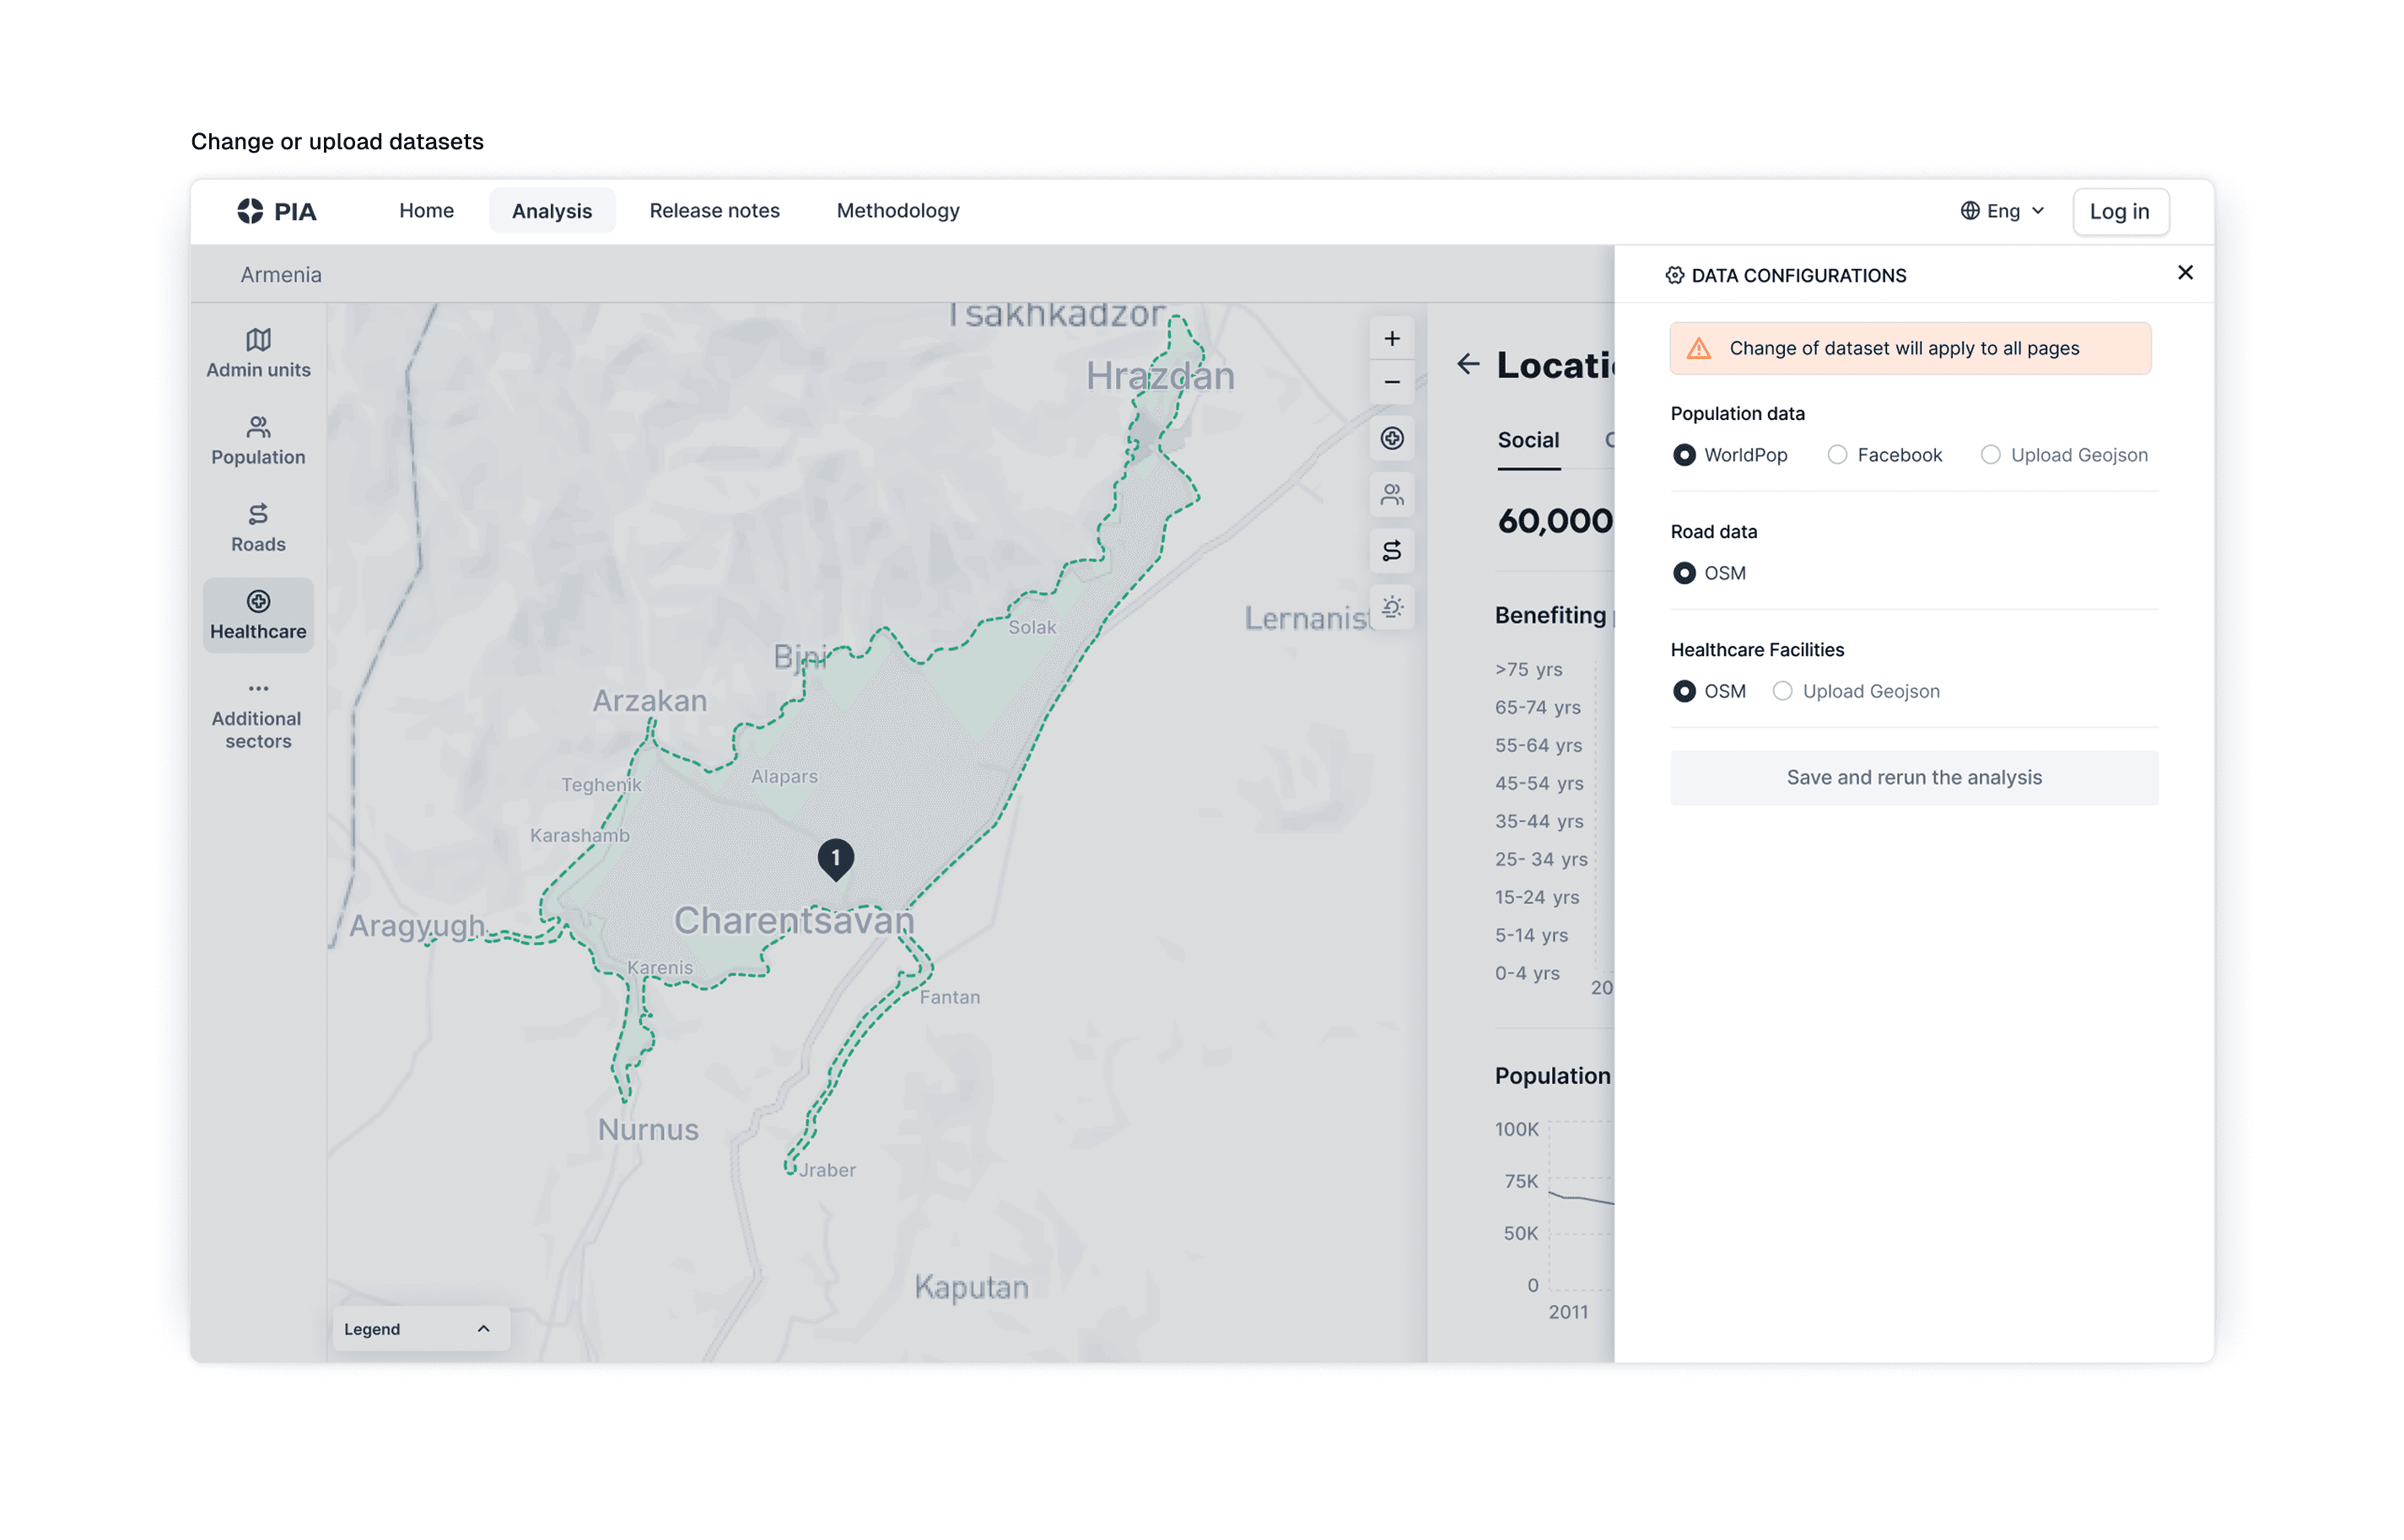
Global datasets by default
To enable comprehensive analysis the tool will operate on global datasets by default.
Upload local datasets
It will also allow users to upload local datasets, ensuring compliance with the tool’s requirements.